Magnetic Resonance Imaging (MRI) has revolutionized the diagnostic process for multiple sclerosis (MS). However, the crucial role of accurate image interpretation cannot be overstated. Misinterpretation of MRI findings and the incorrect application of diagnostic criteria remain significant contributors to misdiagnosis. This article serves as a practical guide for neurologists and radiologists to enhance the recognition of MS lesions on MRI, focusing on typical features and highlighting ‘red flags’ that suggest alternative diagnoses. Understanding these nuances is paramount in establishing the neurology standard of care for new MS diagnoses.
General Considerations for MRI in MS Diagnosis
When utilizing MRI as part of the 2017 revision of the McDonald criteria in diagnosing suspected MS, several key considerations must be kept in mind to ensure optimal diagnostic accuracy:
- Clinical Context is Paramount: The clinical presentation must be consistent with a demyelinating syndrome. MRI findings should always be interpreted in conjunction with clinical symptoms.
- Adult Patient Focus: While the criteria are primarily designed for adults (18-50 years), they are also valuable in pediatric MS, although caution is advised in very young children. Specific pediatric MS considerations exist.
- Age and Vascular Risk: In patients over 50 or with vascular risk factors, a more rigorous interpretation of MRI findings is necessary to differentiate MS lesions from age-related or vascular lesions. Higher thresholds for lesion counts may be appropriate in these populations.
- MRI Quality and Protocols: Studies must be of high quality, minimizing artifacts and performed on scanners with at least 1.5 T field strength. Specific sequences and slice thicknesses (ideally 3D acquisitions or 2D with 3mm slices and no gaps) are recommended to maximize diagnostic yield.
- Essential MRI Sequences: Core sequences include T2-weighted and T1 pre- and post-gadolinium images of both the brain and spinal cord.
- Spinal Cord Imaging: MRI of the cervical, thoracic, and lumbar spine is crucial, particularly when symptoms suggest spinal cord involvement or when brain MRI is inconclusive for dissemination in space. Spinal cord lesions can provide vital diagnostic and prognostic information.
- Optic Nerve Imaging: Fat-suppressed MRI of the optic nerves should be considered in atypical cases to rule out alternative diagnoses, especially in optic neuritis presentations.
- Multiplanar Confirmation: Lesions should be confirmed across multiple planes to avoid false positives due to artifacts and false negatives. 3D sequences (e.g., T2-FLAIR) allow for multiplanar reconstruction, and for 2D acquisitions, a second sequence in a different plane (e.g., sagittal) is advisable.
- Serial Imaging: Given MS is characterized by lesion accrual over time, serial imaging is invaluable to demonstrate dissemination in time and support the diagnosis.
- Expert Interpretation: MRI scans should be interpreted by trained neuroradiologists or clinicians with deep expertise in MS and its differential diagnoses.
- Lesion Dynamics: T2 lesions can fluctuate in size over time, increasing, decreasing, or stabilizing. Rarely, small lesions may disappear completely.
- Gadolinium Enhancement: Gadolinium enhancement in MS lesions is typically transient (2-8 weeks).
- Dissemination in Space: For MS diagnosis, at least one typical MS lesion must be present in at least two characteristic CNS regions (periventricular, juxtacortical/cortical, infratentorial, spinal cord) to fulfill dissemination in space criteria.
- Comorbidities and Lesion Specificity: Brain white matter lesions are common in individuals with vascular disease, migraine, and even healthy adults. Distinguishing MS lesions from those related to comorbidities can be challenging, especially with non-specific small, rounded deep white matter lesions.
- Lesion Characteristics vs. Distribution: In patients with few lesions, individual lesion characteristics (size, shape, orientation, T1 hypointensity, enhancement) are critical. In those with numerous lesions, lesion distribution patterns (periventricular predominance, brain and cord lesion combinations) become more informative.
Table 1. Optimal Imaging Sequences for MS Lesion Identification
| Lesion Category | Core Sequence(s) for Primary Identification | Alternative Confirmatory Sequence(s) |
|---|---|---|
| Core Lesional Features for Diagnostic Criteria | ||
| Periventricular | T2-FLAIR (preferably 3D) | T2-weighted, PD-weighted, 3D T1-weighted MPRAGE |
| Juxtacortical/Cortical | T2-FLAIR (preferably 3D) (Cortical: DIR) | 3D T1-weighted MPRAGE, T2, DIR, PSIR (Cortical: 3D T1-weighted MPRAGE, PSIR; T2-FLAIR less optimal) |
| Infratentorial | T2-FLAIR (preferably 3D) | T2, PD, 3D T1-weighted MPRAGE |
| Spinal cord (cervical + thoracic) | ≥2 sagittal sequences including STIR, T2, PD, PSIR or 3D T1-weighted MPRAGE | Axial T2 |
| Gadolinium-enhancing lesions | Mildly/moderately T1 SE or GE after a single dose gadolinium-based contrast agent with ≥5-min delay | Pre-contrast T1 (optional) |
| Additional MS Lesions Not in Diagnostic Criteria | ||
| Optic nerve | 2D STIR (coronal) Post-contrast fat-suppressed T1 (axial and coronal) | 2D FSE (coronal) 2D STIR (axial) Alternatives: 3D DIR, 2D/3D FSE T2, 2D/3D fat suppressed T2-FLAIR |
| Future Pathophysiology-Based Characteristics | ||
| Central vein sign | 3D T2* (with segmented EPI) T2-FLAIR* (T2-FLAIR + T2* with segmented EPI) | SWI |
| Subpial demyelination | 7 T T2* or MP2RAGE | PSIR and/or 3D T1-weighted MPRAGE; T2-FLAIR less optimal; DIR |
| Smoldering/slowly expanding lesions | Phase of 7 T T2*-weighted GRE | Phase of 3 T 3D T2* or SWI Longitudinal T2 or T1 images |
DIR = double inversion recovery; EPI = echo-planar imaging; FSE = fast spin echo; GE = gradient echo; GRE = gradient recalled echo; MPRAGE = magnetization-prepared rapid gradient echo; MT = magnetization transfer; PD = proton density; PSIR = phase-sensitive inversion recovery; SE = spin echo; STIR = short-tau inversion recovery; SWI = susceptibility-weighted imaging; T2-FLAIR = T2-fluid-attenuated inversion recovery.
Defining Multiple Sclerosis Lesions on MRI
In MS, a lesion is identified as a focal area of hyperintensity on T2-weighted sequences (T2, T2-FLAIR, or similar) or proton density (PD)-weighted sequences. Typical MS lesions are round to ovoid, ranging from millimeters to a centimeter or more in diameter. Generally, a minimum size of 3mm in the long axis is required for diagnostic criteria purposes.
MS lesions commonly occur in both hemispheres, often with mild asymmetry early in the disease course. While lesions can develop anywhere in the CNS, MS lesions exhibit a predilection for specific white matter regions: periventricular and juxtacortical white matter, corpus callosum, infratentorial areas (especially pons and cerebellum), and the cervical spinal cord. Accurate assessment of involvement in these areas is crucial for determining dissemination in space.
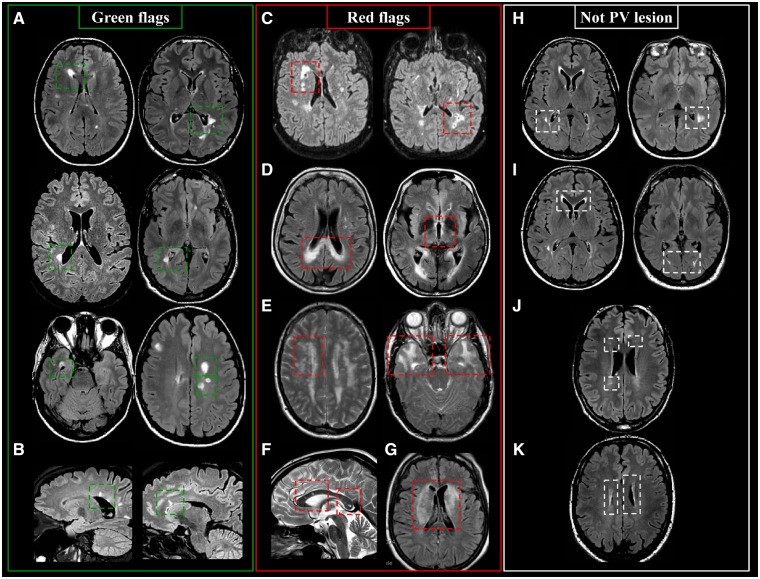
Periventricular Lesions: Green and Red Flags
Periventricular lesions are defined as T2-hyperintense white matter lesions directly contacting the lateral ventricles, without intervening normal-appearing white matter. This definition includes lesions abutting the ventricles and those in the corpus callosum. Lesions adjacent to the lateral ventricles but located within deep gray matter (e.g., thalamus, caudate nucleus) are excluded.
Periventricular MS lesions often align along deep medullary veins, oriented perpendicularly to the lateral ventricles, known as ‘Dawson’s fingers’. T2-FLAIR sequences (preferably 3D) are highly sensitive for detecting these lesions and distinguishing them from enlarged perivascular spaces.
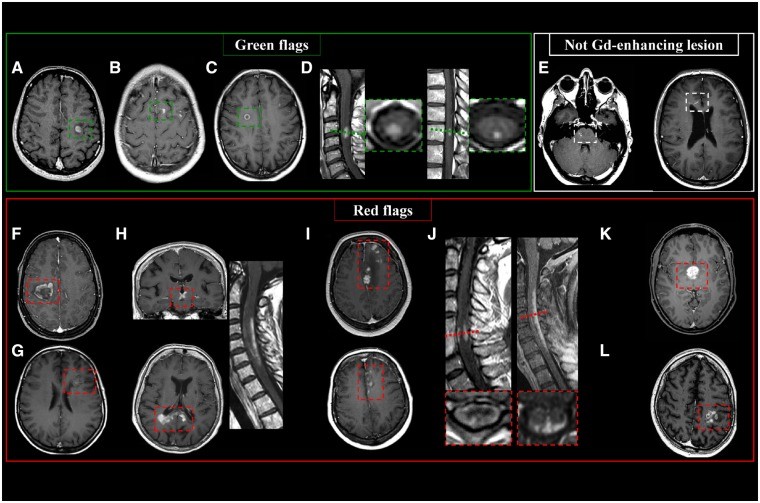
Green Flags (Typical MS Features):
- Lesions abutting the lateral ventricles.
- Ovoid or round shape.
- Orientation perpendicular to the ventricles (‘Dawson’s fingers’).
- Asymmetric distribution.
Red Flags (Atypical Features Suggesting Alternatives):
- Lesions involving paraventricular and deep gray matter regions (suggestive of ischemic small-vessel disease).
- Extensive posterior corpus callosum involvement and bilateral diencephalic lesions (neuromyelitis optica spectrum disorders – NMOSD).
- Deep white matter, external capsule, and temporal lobe lesions (cerebral autosomal dominant arteriopathy with subcortical infarcts and leukoencephalopathy – CADASIL).
- Intra-callosal ‘snowball’ lesions (Susac syndrome).
- Diffuse and extensive lesions in both white and deep gray matter (systemic lupus erythematosus).
- Periaqueductal lesions (NMOSD).
- Periependymal lesions around the lateral ventricles (NMOSD).
- Lacunar infarcts or microbleeds (ischemic small-vessel disease, amyloid angiopathy).
- Extensive symmetric white matter lesions (leukodystrophy).
Lesions to Exclude from Periventricular Lesion Count:
- Lesions not touching the lateral ventricles (paraventricular).
- Symmetric anterior and posterior periventricular ‘capping’.
- Lesions smaller than 3mm in the longest axis.
- Symmetric linear hyperintensities abutting the lateral ventricles (‘periventricular banding’).
- Lesions in deep gray matter structures.
- Lesions touching the third and fourth ventricles or cerebral aqueduct.
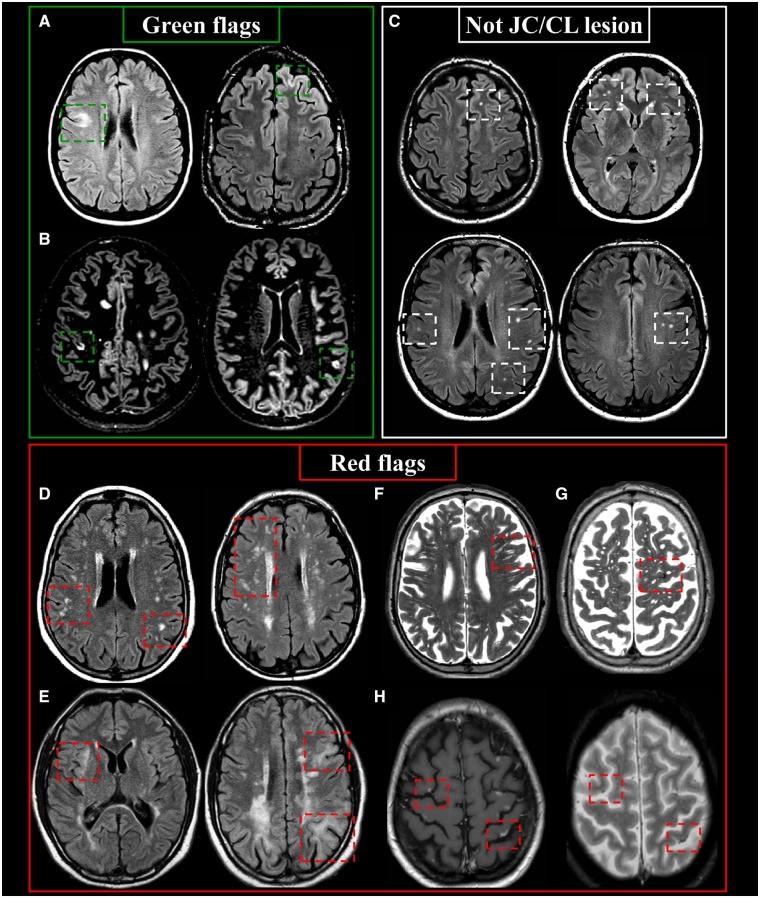
Juxtacortical and Cortical Lesions: Diagnostic Insights
Juxtacortical lesions are T2-hyperintense white matter lesions directly contacting the cortex, without intervening normal white matter. Cortical lesions are located entirely within the cortex or span both cortex and subjacent white matter. T2-FLAIR (preferably 3D) is optimal for detection, with specialized sequences like double inversion recovery (DIR), phase-sensitive inversion recovery (PSIR), or T1-weighted MPRAGE enhancing visualization, especially for cortical lesions.
In MS, juxtacortical lesions typically involve U-fibers and can occur in all brain lobes and the cerebellum. Cortical lesions in MS can be subclassified based on histopathology, including Type I (cortico-subcortical), Type II (small perivenous intracortical), Type III (subpial demyelination), and Type IV (transcortical). Morphologically, cortical lesions can be curvilinear/worm-shaped, oval, or wedge-shaped, with curvilinear/worm-shaped lesions being highly suggestive of MS.
Green Flags (Typical MS Features):
- Lesions touching or within the cortex (juxtacortical or cortical).
- Involvement of U-fibers (juxtacortical).
- Curvilinear/worm-shaped cortical lesions.
Red Flags (Atypical Features Suggesting Alternatives):
- Small cortical infarcts (diffusion restriction or T1-hyperintensity suggestive of cortical laminar necrosis).
- Multiple subcortical white matter lesions (ischemic small-vessel disease).
- Multiple well-defined CSF-like abnormalities (enlarged Virchow-Robin spaces).
- Hypointensity on T2-weighted images (microbleeds).
- Leptomeningeal/cortical hyperintensities on T1-weighted images (CNS vasculitis).
- Ill-defined borders of lesions involving the grey matter-white matter border (progressive multifocal leukoencephalopathy – PML).
Lesions to Exclude from Juxtacortical/Cortical Lesion Count:
- Deep white matter lesions separated from the cortex by a rim of white matter (subcortical).
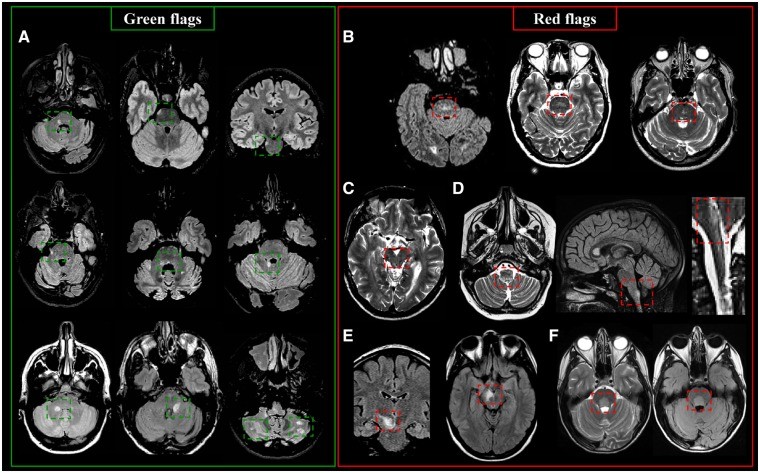
Infratentorial Lesions: Key Differentiators
Infratentorial lesions are T2-hyperintense lesions in the brainstem, cerebellar peduncles, or cerebellum. They often occur near the surface or centrally with an ovoid/round shape. Discrete sub-pial ‘linings’ along the brainstem periphery can also be seen.
In the pons, MS lesions are frequently contiguous with cisterns or involve the floor of the fourth ventricle, pontine surface, and pontine trigeminal root entry zone. In the midbrain, lesions often involve the cerebral peduncles and periaqueductal gray matter. Medullary lesions typically exhibit a uni- or bilateral paramedian location. Cerebellar lesions can occur in any white matter portion or peduncle, commonly affecting the middle and superior cerebellar peduncles.
Green Flags (Typical MS Features):
- Lesions in the brainstem, cerebellar peduncles, or cerebellum.
- Peripheral location in the pons.
- Association with cisterns or the fourth ventricle floor.
- Ovoid/round shape.
- Uni- or bilateral paramedian location in the medulla.
Red Flags (Atypical Features Suggesting Alternatives):
- Symmetric central pontine lesions (small-vessel disease).
- Periaqueductal lesions (NMOSD).
- Area postrema lesions (NMOSD).
- Mesencephalic-diencephalic lesions (anti-MOG syndrome).
- Large ovoid lesions close to the fourth ventricle floor (neuro-Behçet disease).
- Fluffy, cloud-like lesions in the brainstem and cerebellar peduncles (anti-MOG-IgG disease).
- Miliary pattern lesions with curvilinear enhancement (chronic lymphocytic inflammation with pontine perivascular enhancement responsive to steroids – CLIPPERS).
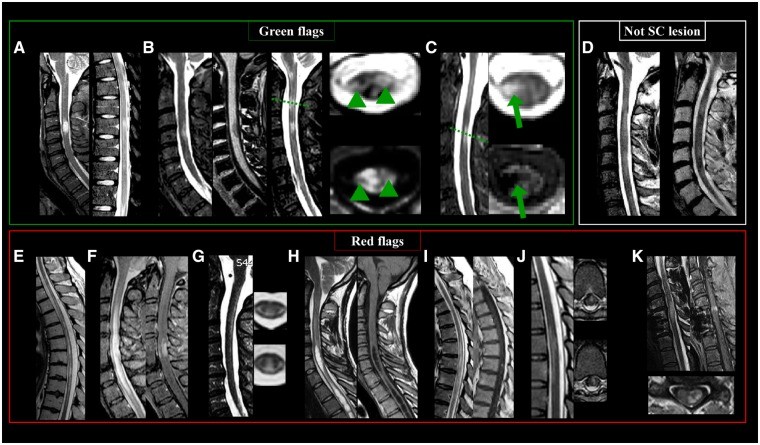
Spinal Cord Lesions: Specific Features for MS
MS spinal cord lesions are often multiple and short in cranio-caudal extent, hyperintense on T2-weighted sequences. The cervical cord is most frequently affected. Lesions should be identifiable on at least two sequences or in two planes to differentiate them from artifacts.
MS spinal cord lesions are typically focal, with well-defined borders, cigar-shaped on sagittal images, and wedge-shaped on axial images. They are usually small (≤2 vertebral segments, < half of cord area) and located peripherally, mainly in lateral or dorsal columns, though anterior white matter and central gray matter can be involved. While historically described as rarely T1 hypointense, higher field strength imaging reveals T1 hypointensity in MS cord lesions.
Green Flags (Typical MS Features):
- Multiple, discrete (focal) lesions.
- Cigar-shaped on sagittal images.
- Wedge-shaped on axial images.
- Small size (≤2 vertebral segments).
- Peripheral location (lateral or dorsal columns).
- Cervical predominance.
- T1 hypointensity (especially at higher field strengths).
Red Flags (Atypical Features Suggesting Alternatives):
- Longitudinally extensive transverse myelitis (LETM) affecting ≥3 vertebral segments (NMOSD).
- Leptomeningeal/root enhancement (neurosarcoidosis).
- Cavities (syringohydromyelia).
- Micro/macrobleeds and ischemic lesions (arteriovenous fistula, ischemic myelopathy).
- Indistinct/diffuse/increasing lesions (malignancy).
- Lesions involving only the gray matter (NMOSD, infections, ischemic myelopathy).
- Preferential involvement of the most caudal portion of the spine (anti-MOG-IgG disease).
- ‘Snake eye’ or ‘owl’s eye’ sign (ischemia or infarction).
- Spinal cord compression (spondylotic myelopathy).
Features to Exclude from Spinal Cord Lesion Count:
- Diffuse abnormalities without clear borders.
Gadolinium-Enhancing Lesions: Temporal Dynamics and Interpretation
Gadolinium enhancement is crucial for evaluating suspected MS, supporting dissemination in time. Enhancement in new inflammatory demyelinating lesions is transient (2-8 weeks). Prolonged enhancement (>3 months) should raise suspicion for alternative pathologies.
An enhancing lesion is defined as a ≥3mm area of hyperintensity on T1-weighted images ≥5 minutes post-contrast. Moderately T1-weighted spin-echo or gradient-echo images are preferred for visualization.
Green Flags (Typical MS Features):
- Nodular enhancement.
- Open-ring enhancement (especially in larger lesions abutting ventricles or cortex).
- Closed-ring enhancement.
- Short duration (2-8 weeks).
Red Flags (Atypical Features Suggesting Alternatives):
- Large or multiple closed-ring enhancement (acute disseminated encephalomyelitis – ADEM, malignancy, infection).
- (Lepto)meningeal/root enhancement (neurosarcoidosis).
- Trident sign (neurosarcoidosis).
- Pancake sign (spondylotic myelopathy).
- Punctate or miliary enhancement (CLIPPERS, vasculitis, PML, Susac syndrome).
- Band-like enhancement (Baló’s concentric sclerosis).
- Cloud-like enhancement (NMOSD).
- Purely cortical enhancement (subacute ischemia).
- Persistent enhancement >3 months (malignancy, sarcoidosis).
- Patchy and persistent enhancement (capillary telangiectasia).
Optic Nerve Lesions: Adjunct Imaging in MS
Optic nerve imaging, while not mandatory for dissemination in space, can confirm optic nerve involvement in MS and exclude alternative diagnoses in atypical optic neuropathies. Coronal fat-suppressed T2-weighted sequences and post-contrast fat-suppressed T1-weighted sequences are recommended.
Typical acute optic nerve lesions exhibit T2 hyperintensity, swelling, and contrast enhancement. Chronic lesions show atrophy and T2 hyperintensity.
Green Flags (Typical MS Features):
- T2 hyperintensity in the optic nerve.
- Optic nerve swelling (acute lesions).
- Contrast enhancement (acute lesions).
Red Flags (Atypical Features Suggesting Alternatives):
- Posterior optic nerve involvement including the chiasm (NMOSD).
- Simultaneous bilateral optic nerve involvement (NMOSD, anti-MOG-antibody mediated disease).
- Long optic nerve lesion (NMOSD, anti-MOG-antibody mediated disease).
- Perioptic nerve sheath enhancement extending beyond the nerve (granulomatous disease, tumor, infection, anti-MOG-IgG disease).
Emerging MRI Techniques for Enhanced MS Diagnosis
Central Vein Sign: Increasing Specificity
The central vein sign (CVS), visualized with high-resolution 3D T2*-weighted MRI, reflects the perivenular nature of MS lesions. Detecting a vein within a lesion increases the likelihood of it being an MS lesion compared to other white matter lesions. CVS is being investigated as a potential marker to improve diagnostic specificity for MS.
Subpial Demyelination: Advanced Imaging Insights
Subpial demyelination, a highly specific cortical lesion type in MS, is often missed with standard MRI. Ultra-high field 7T MRI with T2* or MP2RAGE sequences improves visualization, offering potential for enhanced diagnostic accuracy and understanding of cortical pathology in MS.
Smoldering/Slowly Expanding Lesions: Implications for Progression
Smoldering or slowly expanding lesions, characterized by a hypointense rim on susceptibility-based MRI, represent chronic active lesions associated with ongoing tissue damage and disease progression. Identifying these lesions in vivo holds promise for monitoring disease activity and prognosis, potentially refining the neurology standard of care in progressive MS.
Conclusion
Accurate MRI interpretation is fundamental to the neurology standard of care for diagnosing multiple sclerosis. While MRI is highly sensitive for detecting white matter lesions, specificity requires careful attention to lesion characteristics, distribution patterns, and the consideration of ‘red flags’ that suggest alternative diagnoses. This guide emphasizes the importance of integrating clinical context with detailed MRI analysis to minimize misdiagnosis and optimize patient care in MS. Ongoing advancements in MRI techniques, such as central vein sign imaging and visualization of smoldering lesions, hold promise for further refining diagnostic accuracy and our understanding of MS pathogenesis, ultimately leading to improved patient outcomes.
References